Visualising the Linked Data Structure
Info
This section of Describo is not just for producing nice visualisations of the network structure. It goes hand in hand with the Discover section in your digital discovery process. That is, you can use Discover to deep dive into the data for specific information that you are interested in and / or know exists. Or, you can use these tools to get an overview of what you actually have as the first part of the process of understanding your data.
Info
Try this yourself. Get the Taylor Swift Dataset; unzip it and load it into Describo.
Introduction
Describo is built around the creation and management of linked data.
Info
Linked data is defined in Wikipedia ...as structured data which is interlinked with other data.. (there is a lot more to it than that but for our purposes right now, that's all we need).
In the following image, we can see what that means.In it we see two nodes (circles) that represent two interlinked entities. One is an entity of type CreativeWork named ro-crate-metadata.json. The other is of type Dataset and named My Research Object Crate. The two nodes (or entities, used interchangably) are linked to each other via a property about. This example is telling us that the CreativeWork is about the (interlinked) Dataset.
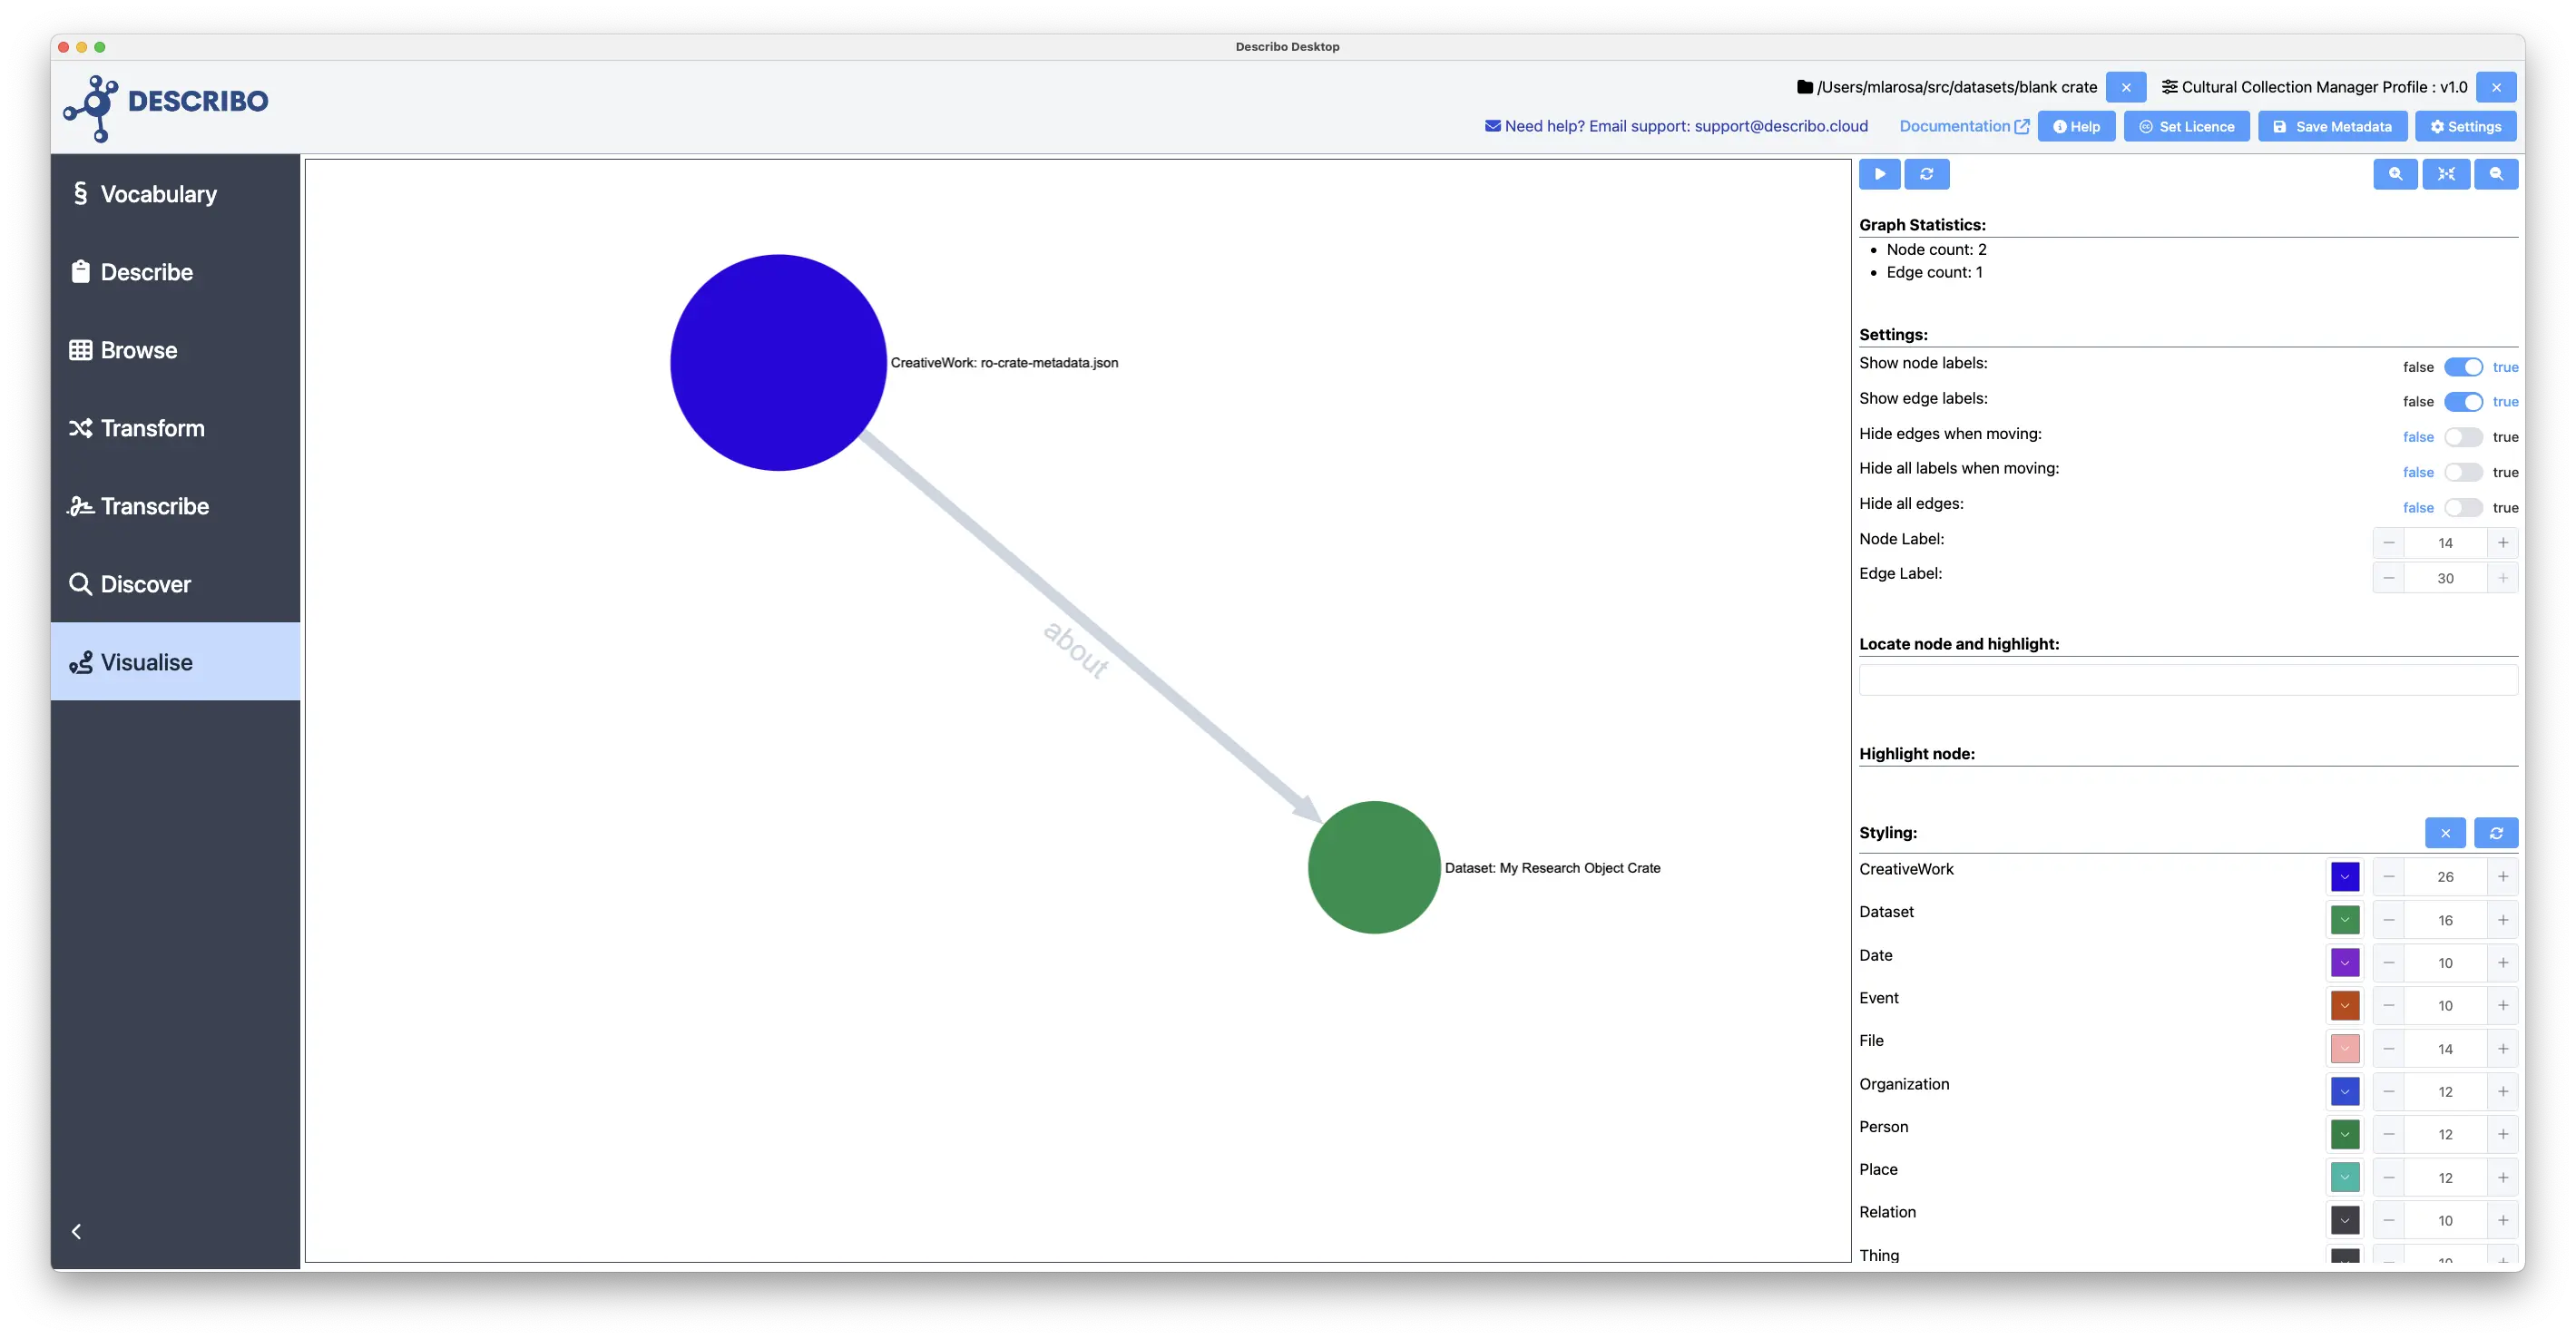
In this way, we can model complex relationships between named entities and then go on to describe them further.
The visualise section
In the example above we already saw the visualise section. When you first navigate to it you will see the network canvas on the left and controls on the right. Following is the view when pressing help in the navigation bar.
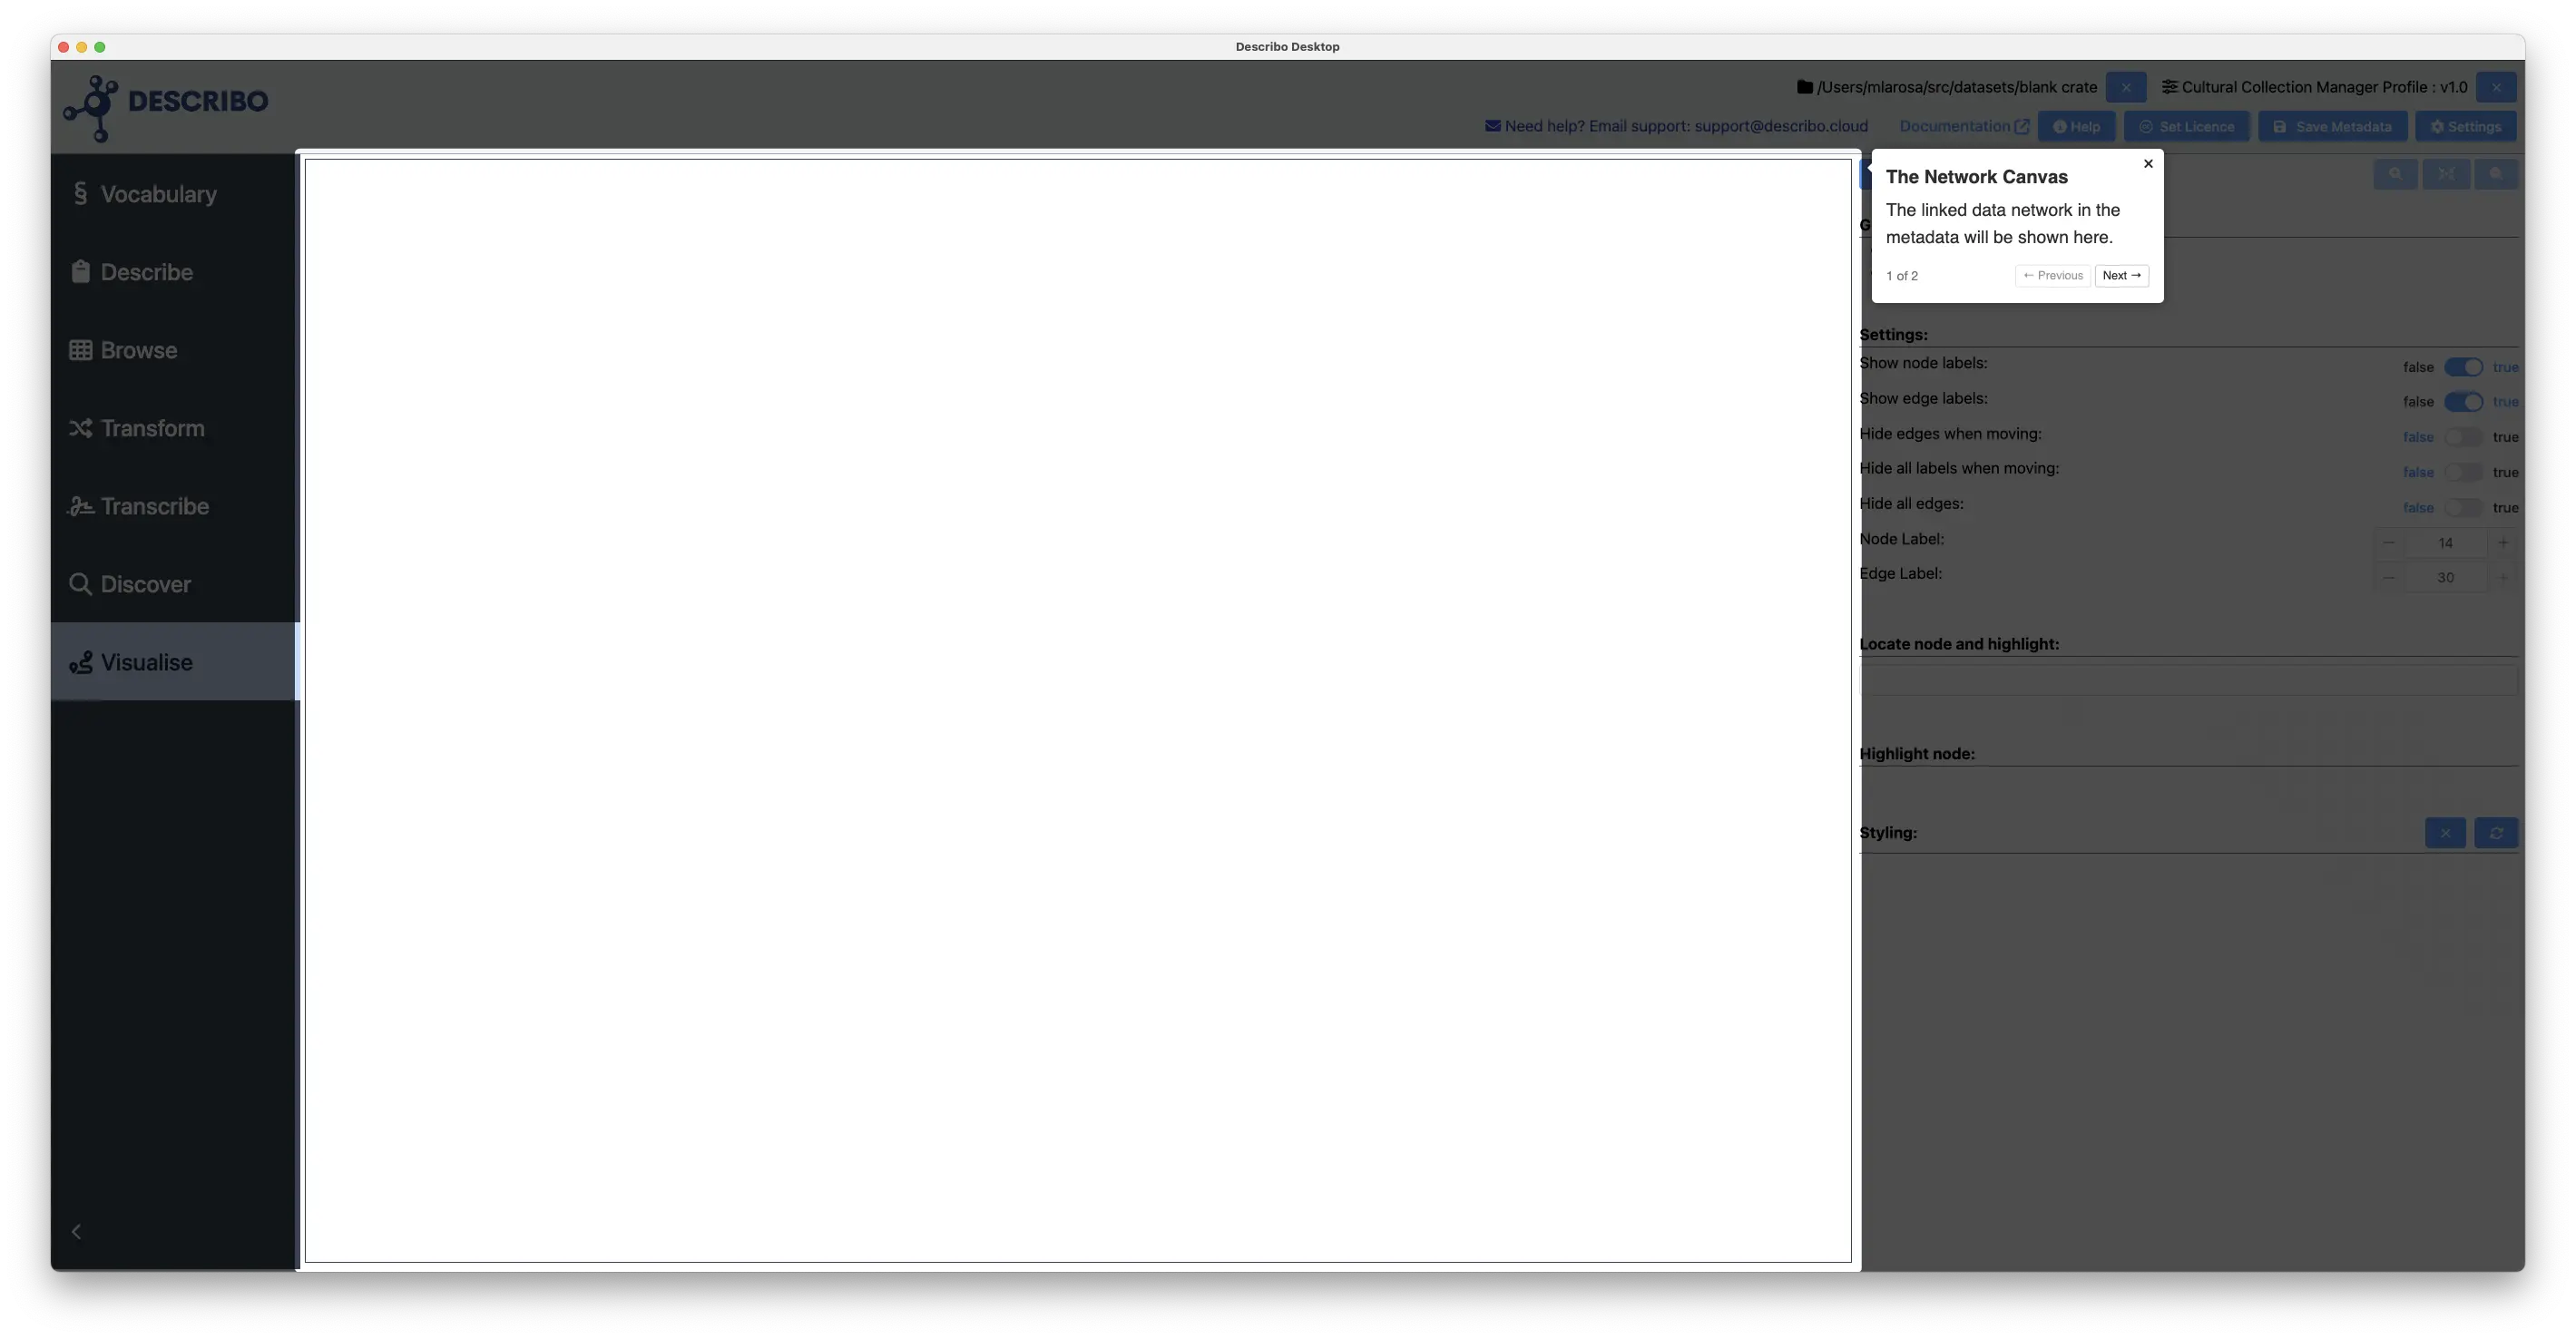
Get started by pressing the button at the top of the controls.
When you do, the network structure in the metadata will be displayed. Following is a visualisation of the entities, topics, themes and subjects in the Taylor Swift Song Dataset.
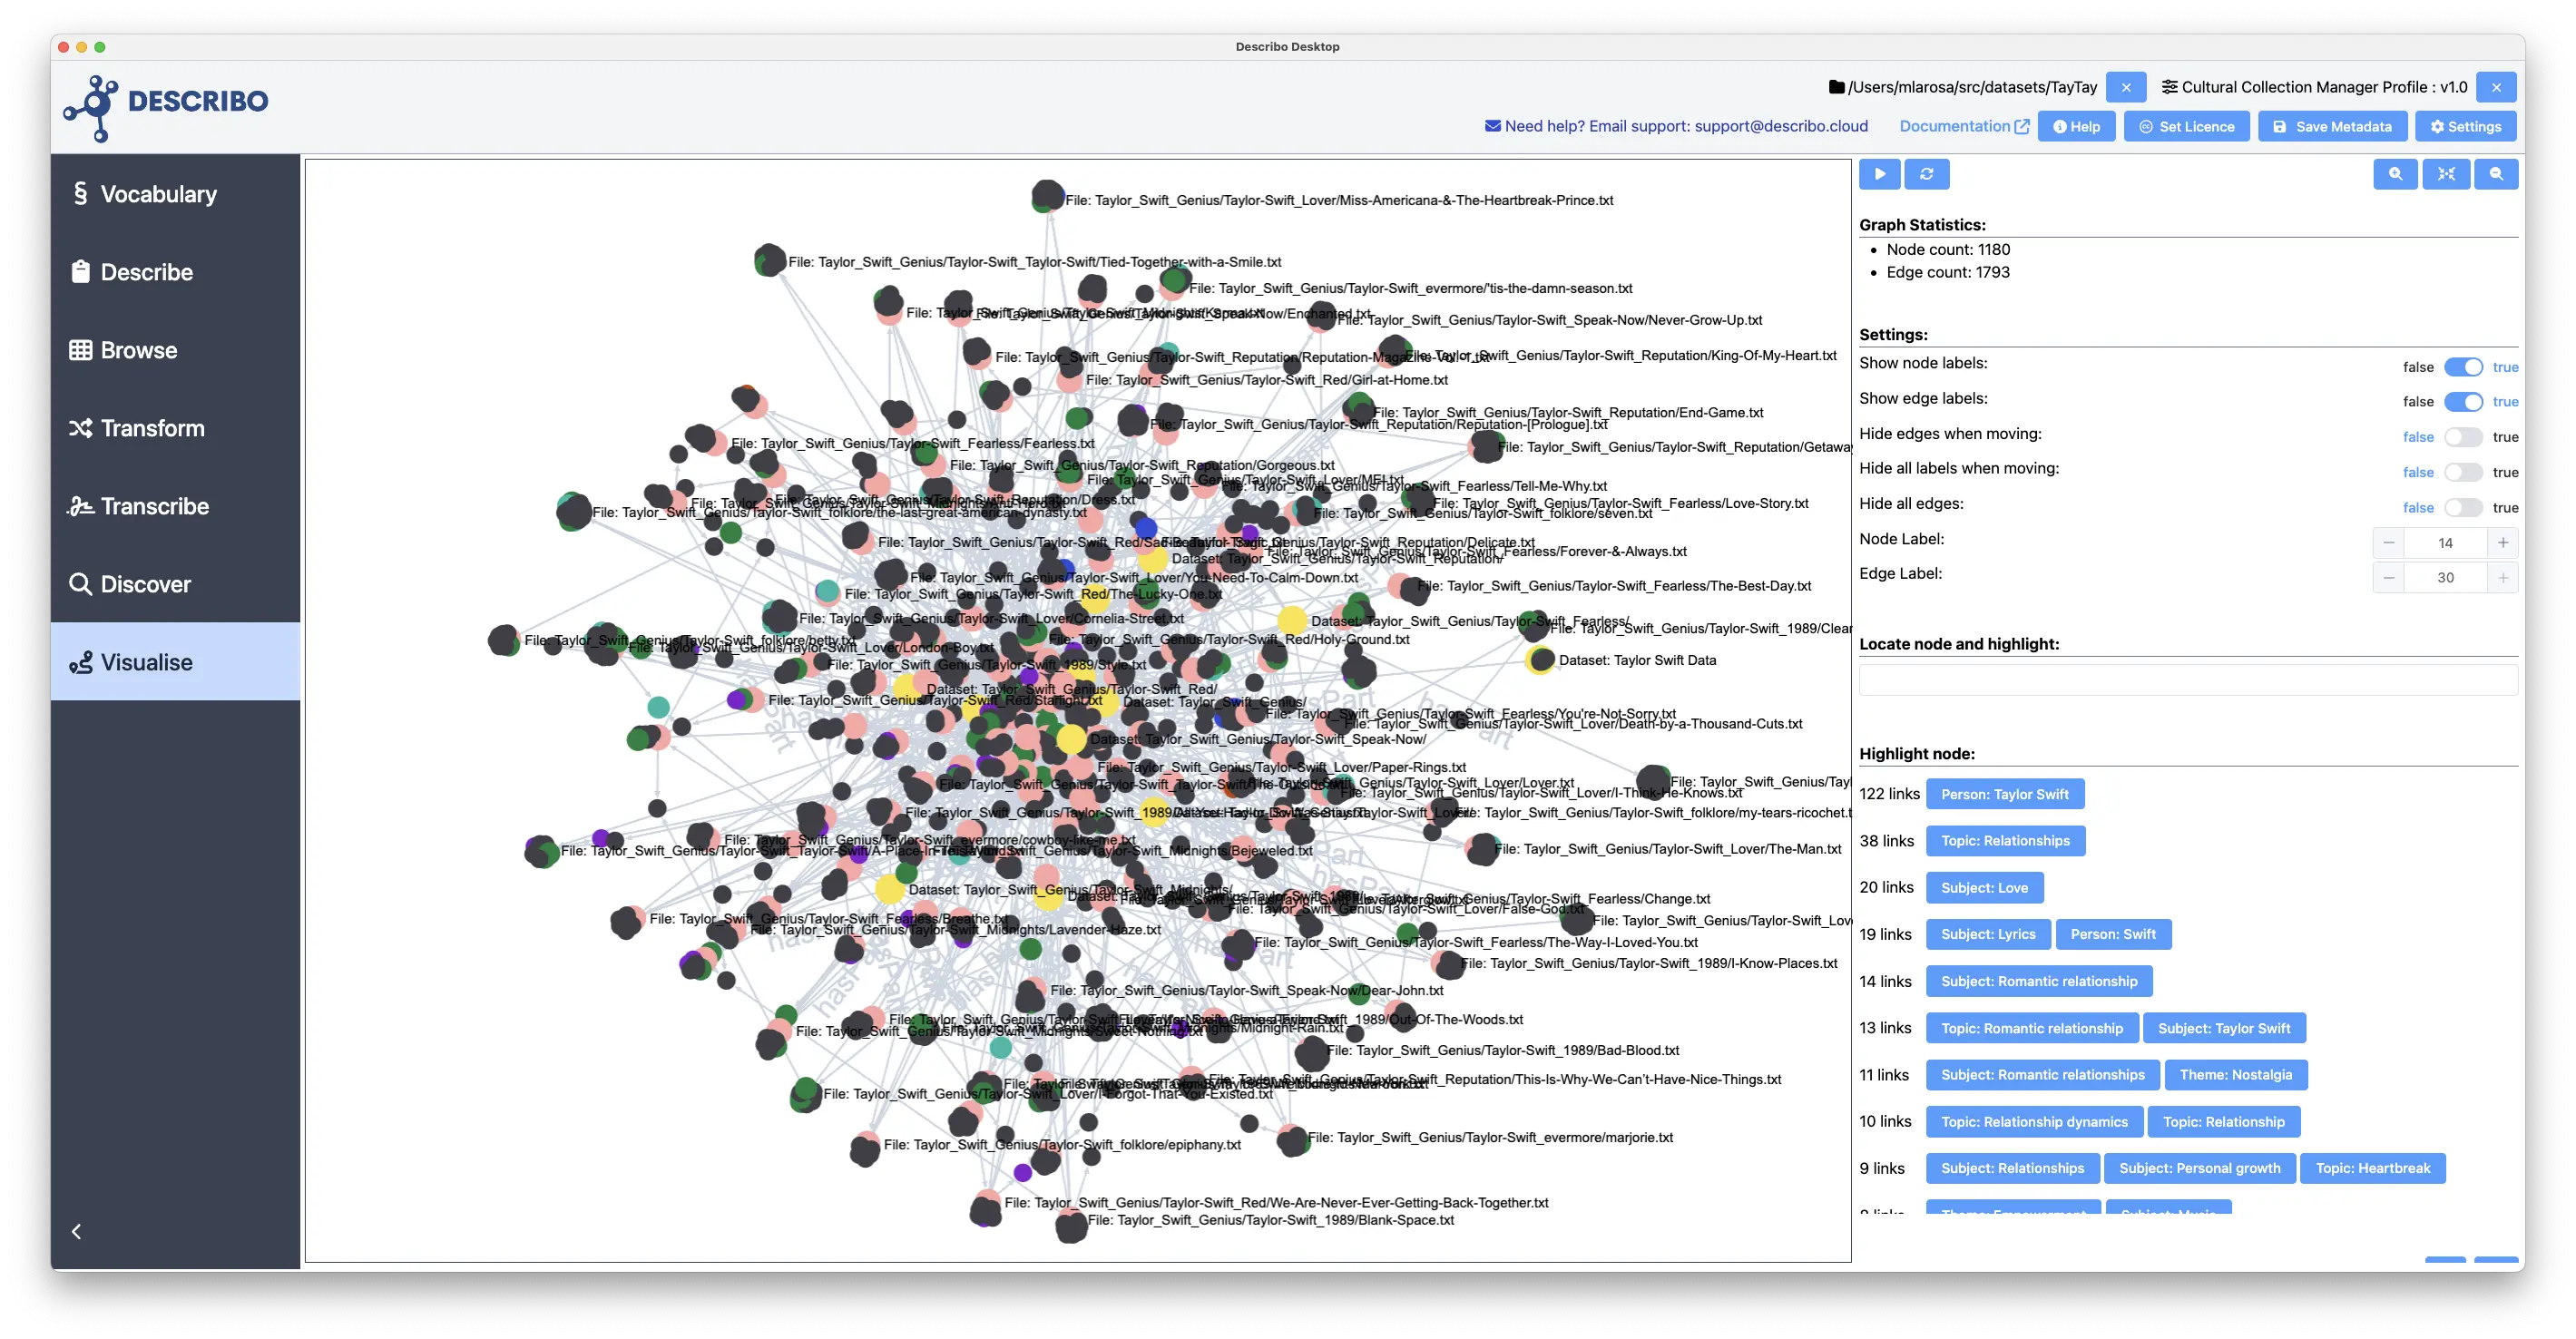
There's a lot going on so let's break it down.
- The first step involves extracting the entities, topics, themes and subjects from the data. This was done using the controls in the Transform section of Describo. As the source data (the song files) are plain text files, all of the content extracted from them was marked up in the metadata directly.
- In the controls we see that there are 1180 nodes (entities) and 1793 edges (connections between entities).
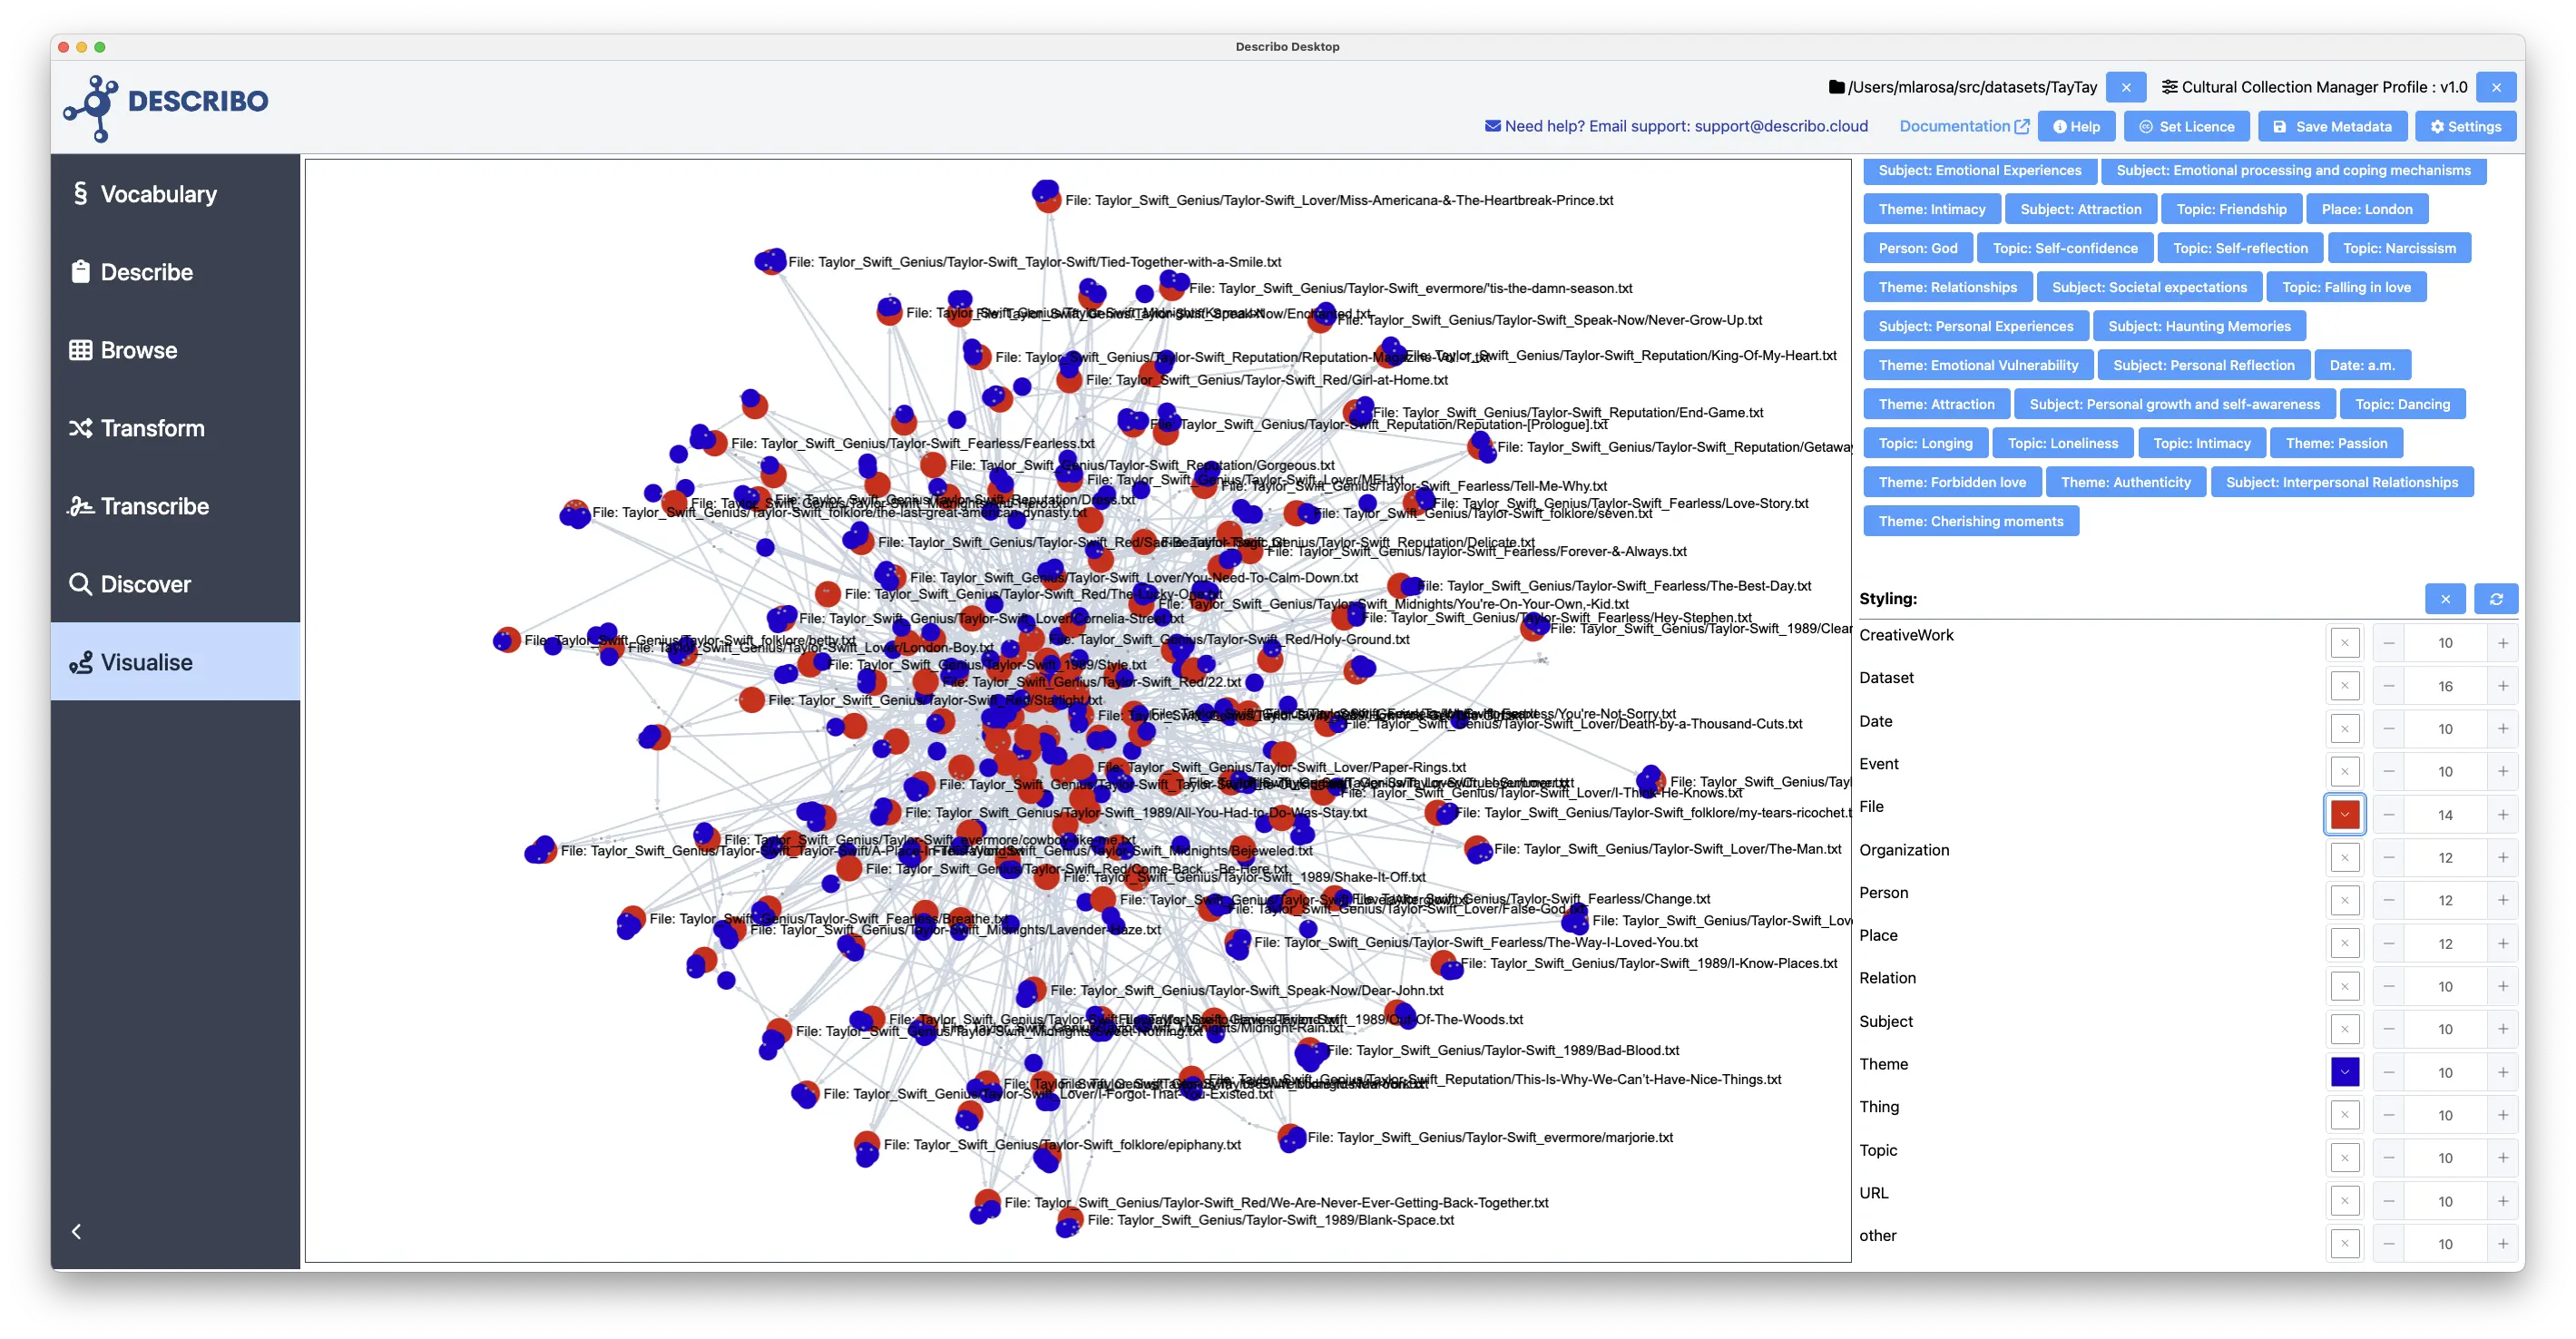
- Describo has assigned default colours to the main entity types. However, using the controls in the Styling section at the bottom of the controls, we can choose to recolour the visualisation. If, for example, we wished to focus on the relationship between Songs and Topic, we might colour only those node types, viz:
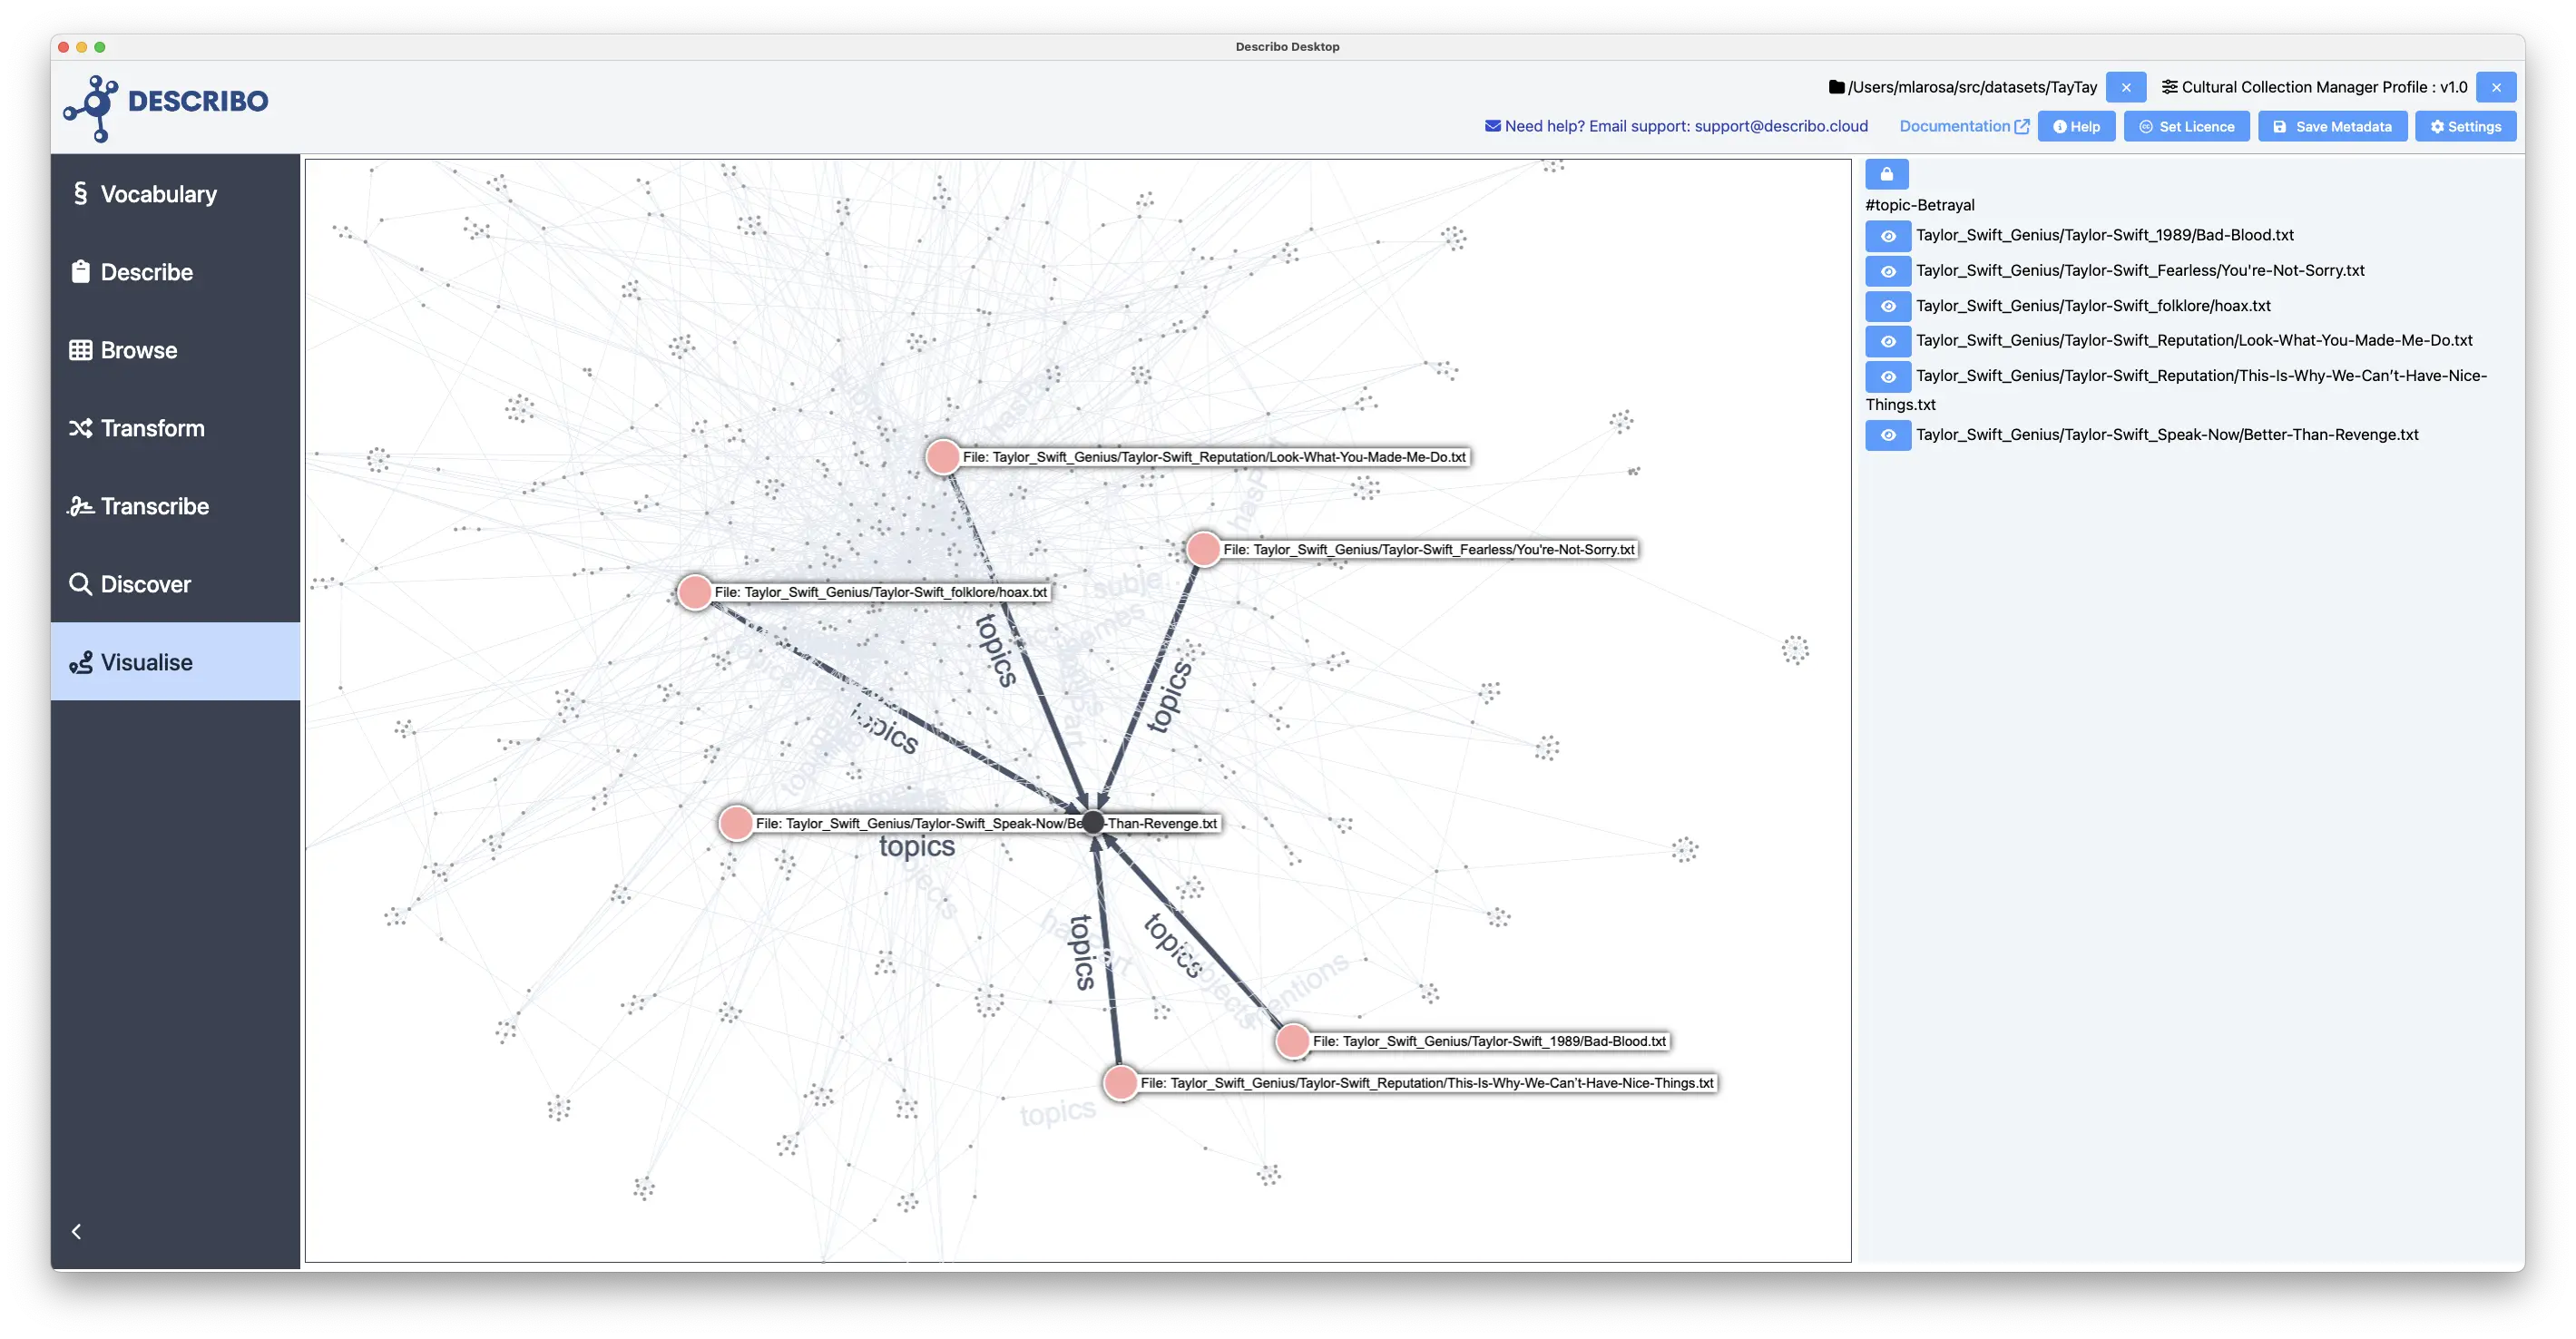
Browsing around the graph we can inspect those relationships in more detail. In the following image we can see that Betrayal is a topic in six songs.
Controls
The Settings section provides toggles to enable / disable various features. In addition, the node and edge text size can be changed. These controls will help you when navigating and exploring very large graphs.
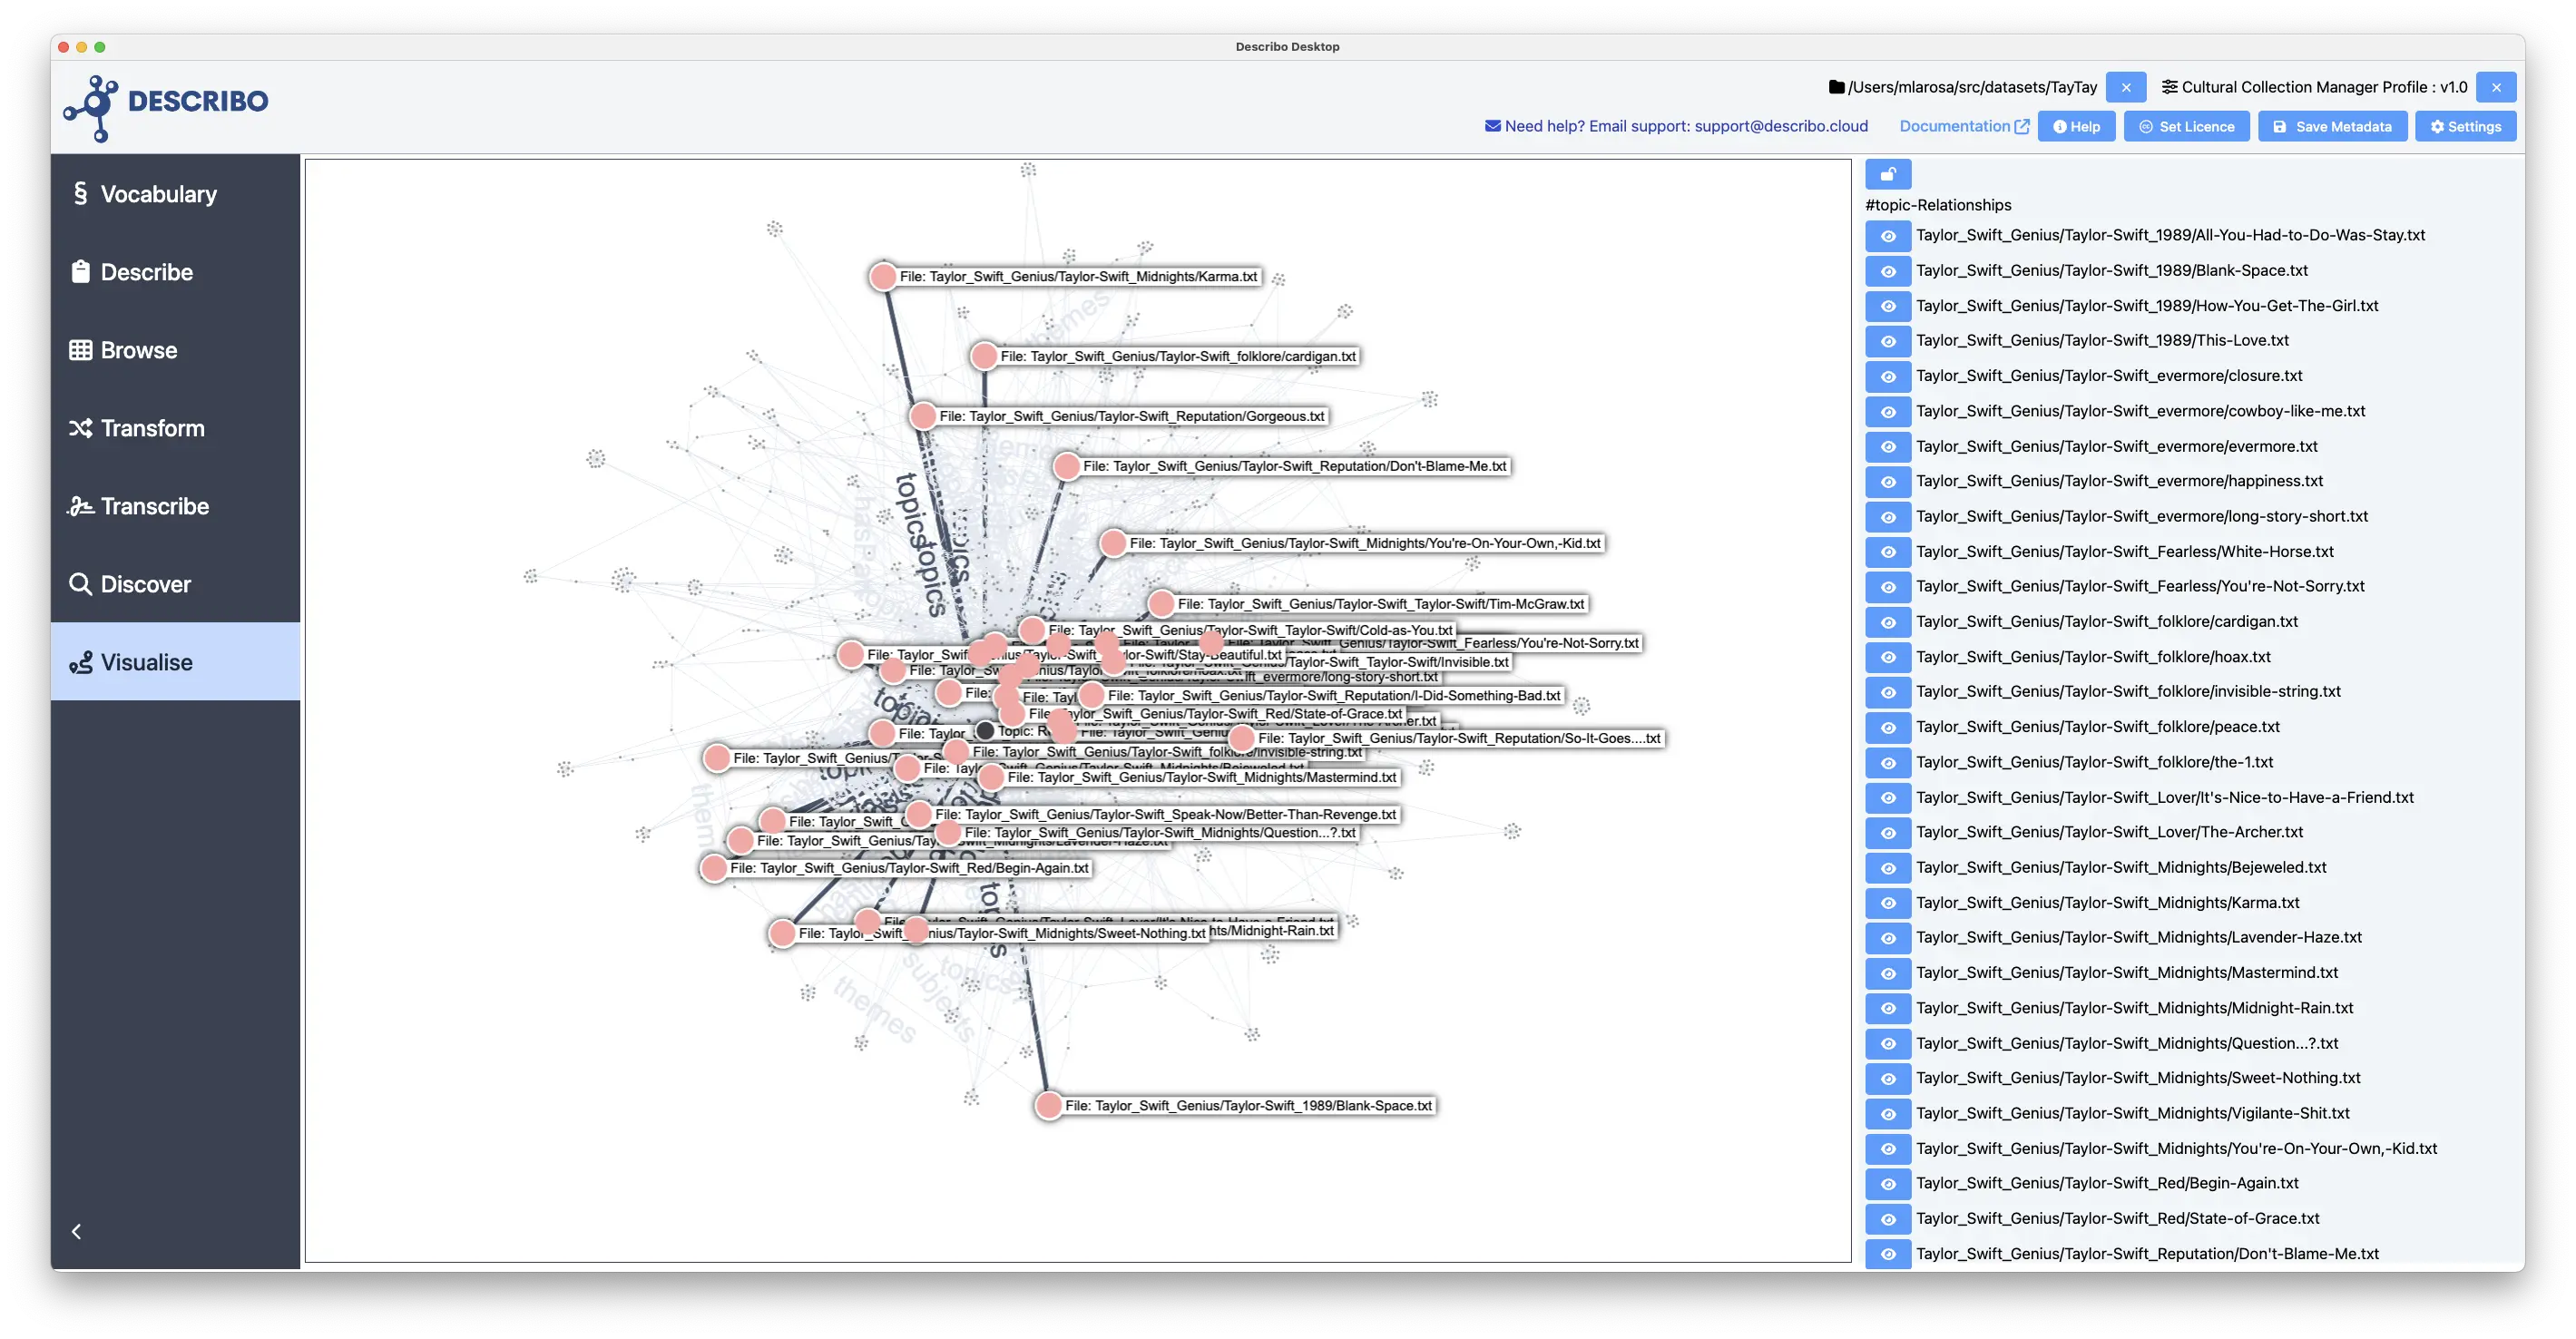
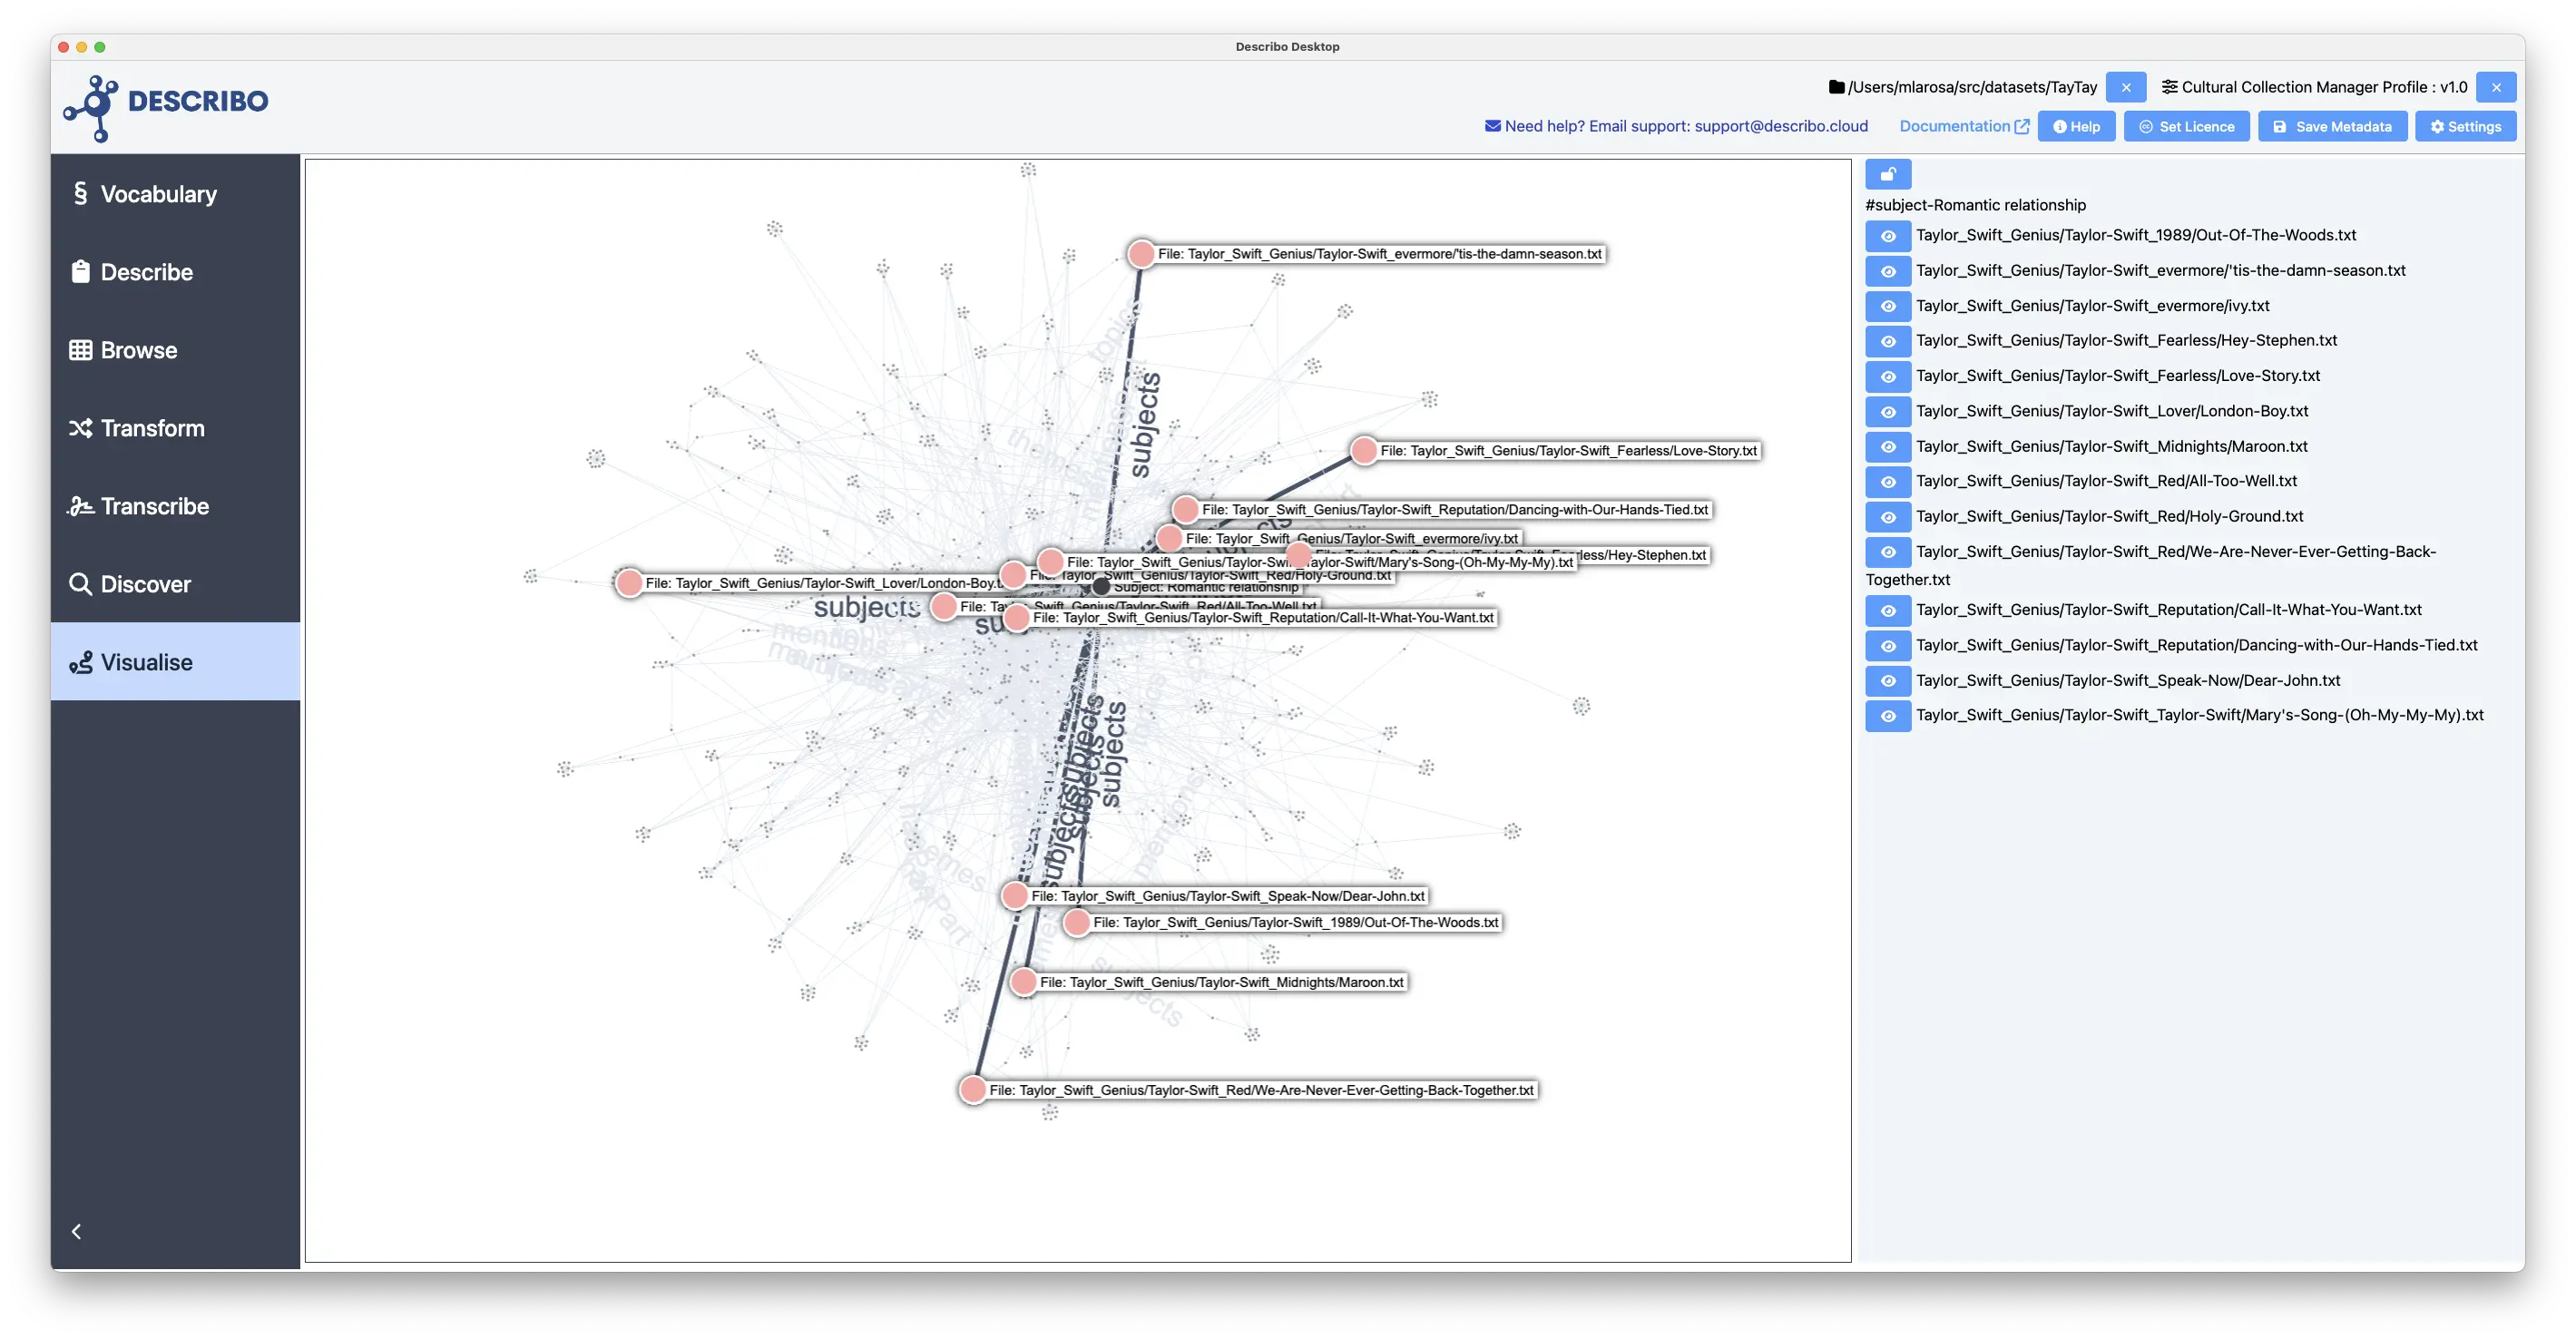
The Highlight node section has a control to see the most highly linked entities in descending order. In a discovery process, seeing the most highly linked topics, themes and subjects can provide insight into where to look for more detail. With this control, you can selectively highlight the most interlinked entity. In the following image we see that the Topic
Relationshipsis discussed in 38 of Taylor's songs. Not surprising really. But we can then find that the next most discussed topic isRomantic Relationshipin 13 songs.